Introduction and Project Overview
In the past few days, I built a small web application to explore how movies can be visually connected based on what I have watched. The objective is to explore modern data visualization techniques and frontend technologies, rather than to resolve a particular problem.
The application allows users to search for movies using the TMDb API and add selected films to a personal library stored in the browser’s localStorage. Once movies are added, they are represented in a dynamic force-directed graph built with D3.js. This graph creates visual clusters that help identify patterns between movies: for example, shared genres, themes, or general similarities.
Architecture and Tech Stack
As a foundation for this application, I decided to use React and Vite:
- React.js is a JavaScript library that lets you build user interfaces based on individual components. These components manage state and respond to users’ actions, making it easier to develop interactive and scalable applications.
- Vite is a frontend build tool designed to create fast and efficient frontend applications, providing a modern development server and optimized build process.
Together, React + Vite provide a modern and powerful environment to start building both simple and complex web apps.
Basic Layout
First, we’ll design a basic frontend layout. I won’t go into detail about CSS and HTML code, as this isn’t the focus of the article and I’m not an expert in that area, but we’ll explore how React is used.
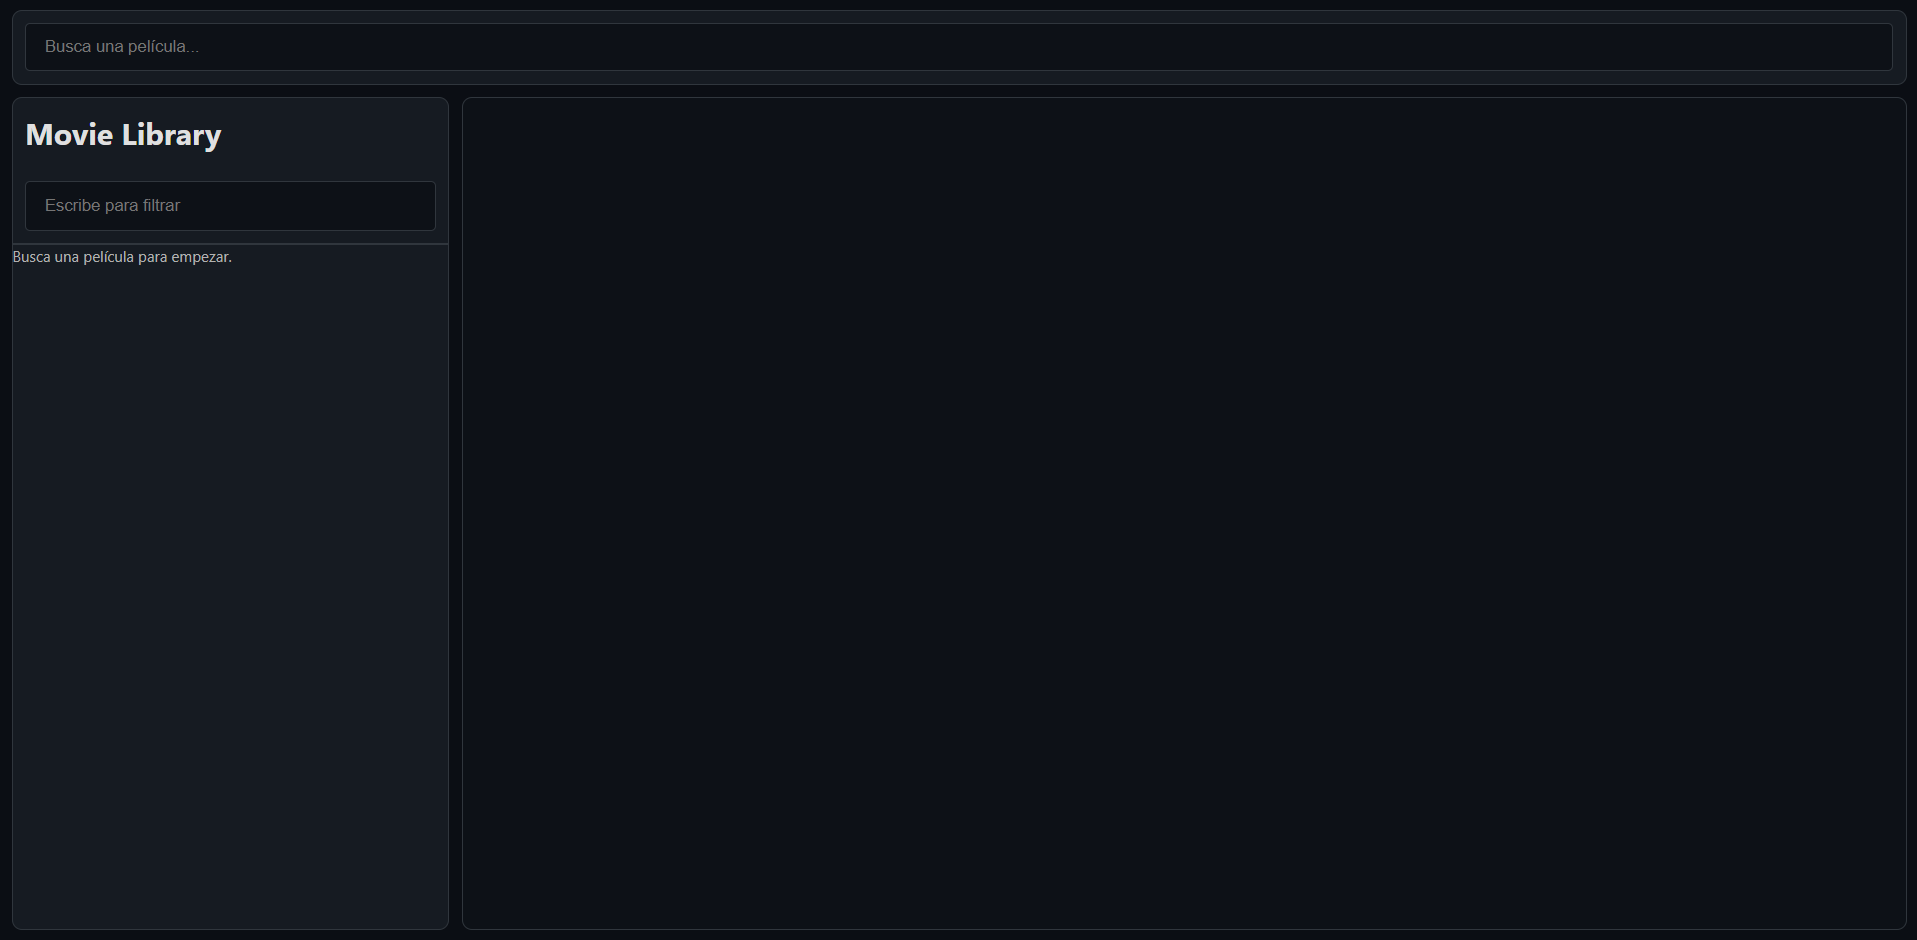
We have three main components:
- The top SearchBar: It is a simple HTML input element, but the value and search results are managed as React states. Using states gives us complete control over what the app does when the input changes. Specifically, if the input has more than three characters, we perform a search using the API and display the results.
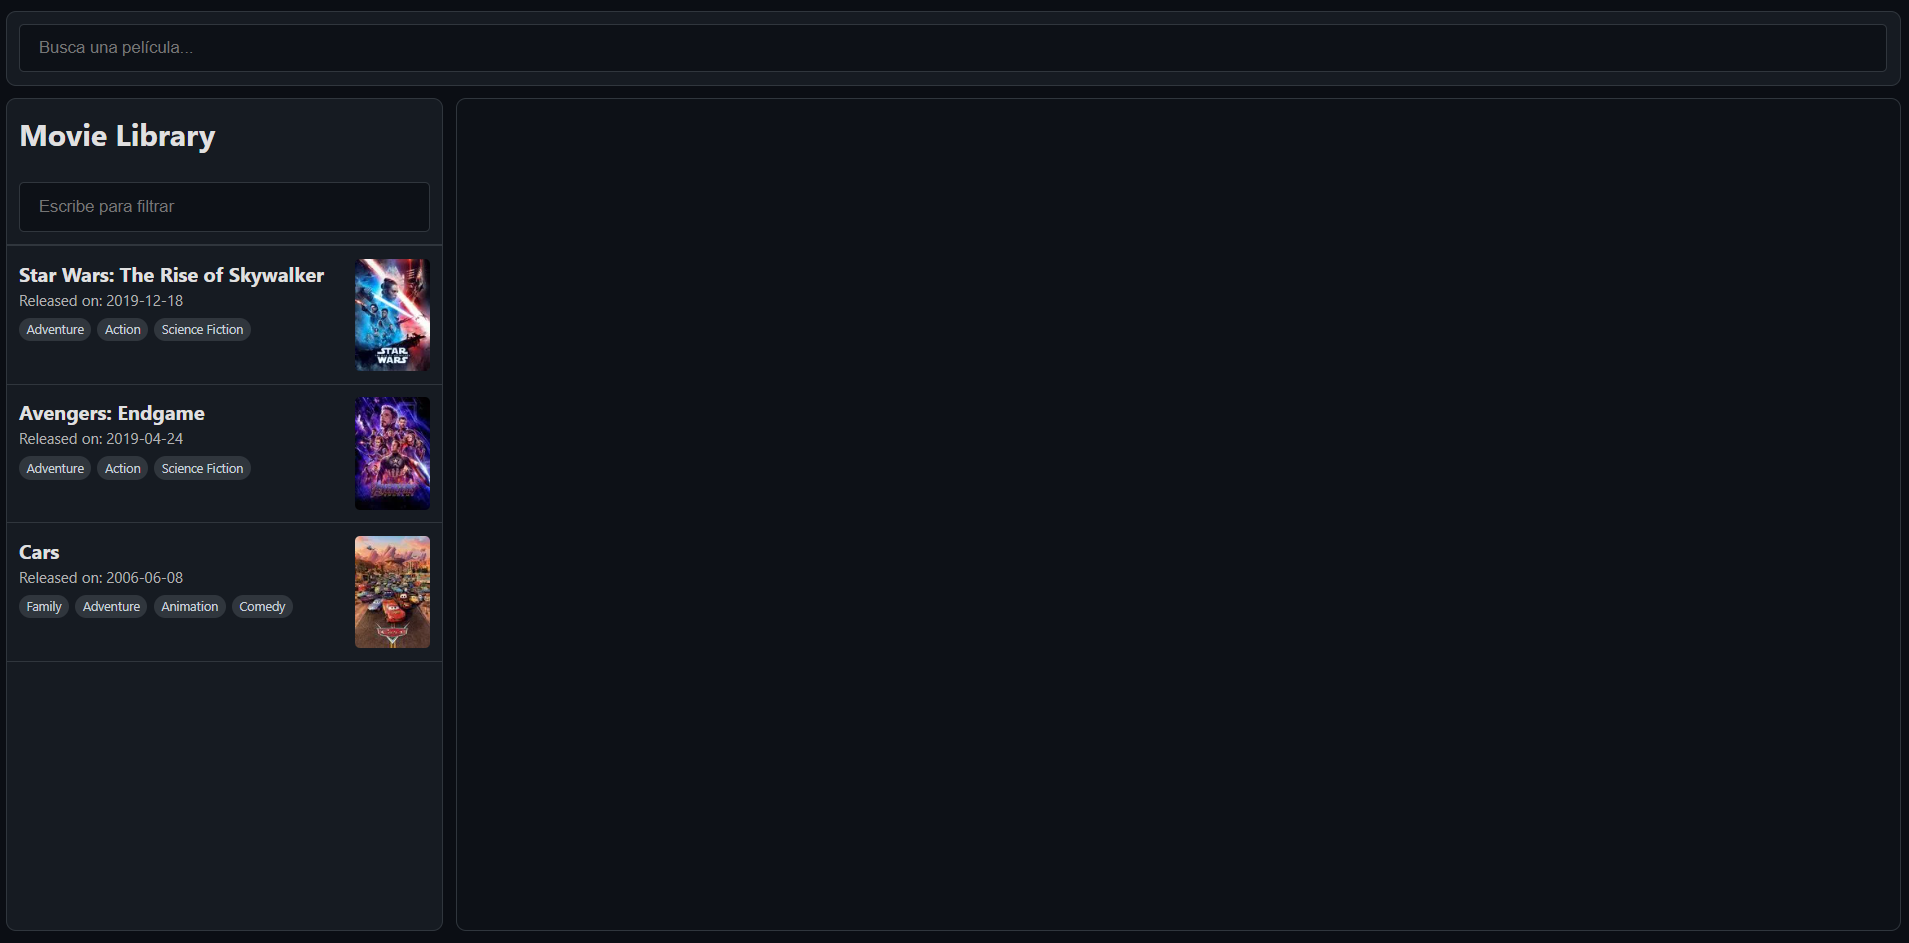
- The Movie Library (on the side): As we search films in the search bar, we can add them to our library.
- The main view of a Relations graph: Once we have some movies in our library, a D3 Force Graph is formed. This representation enables us to visualize relationships between films, which we’ll explain later in the article.
Using React states has another benefit: we can easily share information between components. In our case, we have three components inside the App component (the parent). If a state is defined in the App scope, it can be used by all three components with ease. For example, the movies in the movie library are a state shared by the library and the graph.
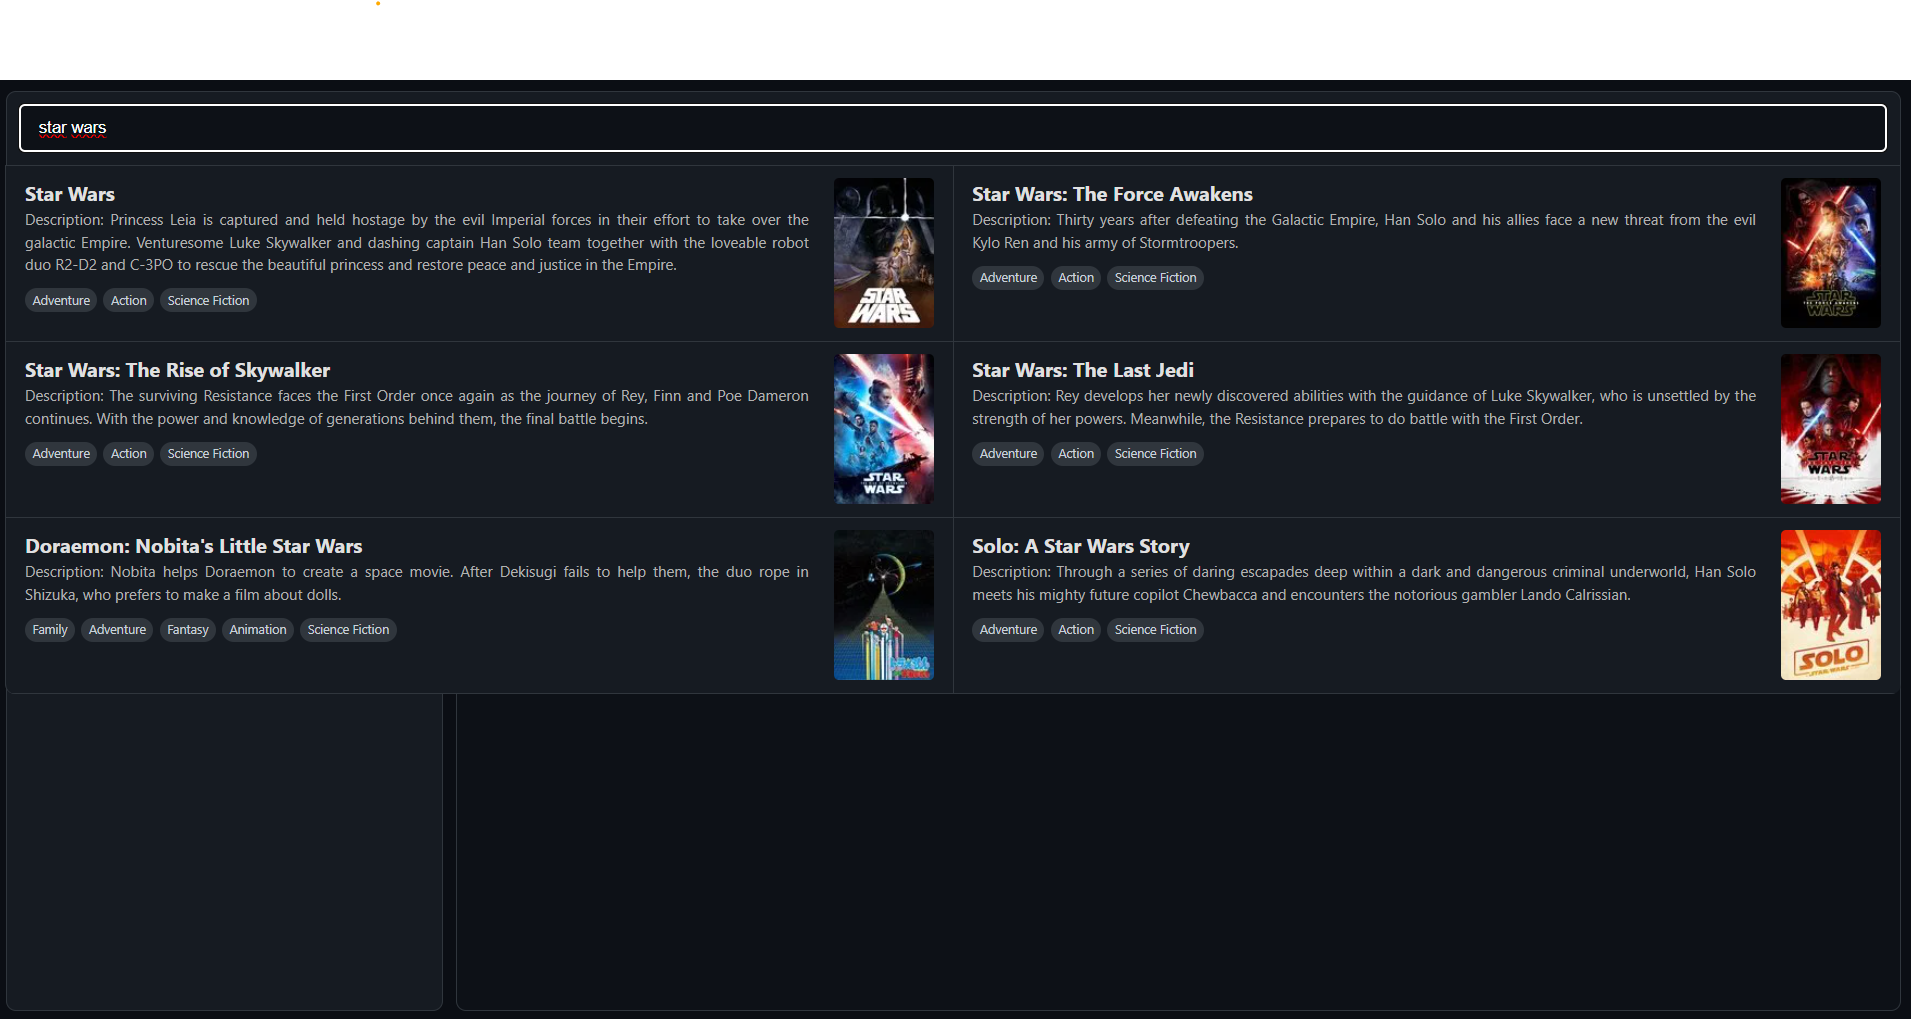
Integrating an API
As mentioned earlier, when the user starts typing in the SearchBar, we want to find films with matching titles. For this, we can use the TMDb API, a popular and free movie database available as a REST API. You only need to register on their website and obtain an API Key. Once we have access to the API, we can implement the search functionality in our app. It’s important to note that since we’re making an HTTP request, we need to handle an async call. Here’s my implementation:
1 | function handleSearch(value) { |
For my app, I get the first 6 results of the API search and load them into a React state. When the state contains more than one movie, the results automatically render below the search bar.
When the user clicks on a result, the React state corresponding to the movie list changes automatically, and the new movie is rendered in the movie library. The next step is to make this library persistent across sessions. For this, we use localStorage to store all the movies and their information in JSON format. Specifically, we trigger the save function when the movie state changes, which can be accomplished with the useEffect React hook.
At this point, I hope you can see all the benefits of using React and I recommend checking the official documentation for more examples.
Generating Movie Relationships
When we have some films in the library, it’s time to create the graph. For a D3 force-directed graph, you need a list of nodes (our movies) and a list of relationships. To do this, we compare each film with every other film and assign a relationship strength between the two films. Currently, we are comparing genres and movie keywords (which we retrieve with an additional API call).
1 | async function calcRelations(movies) { |
This function is triggered when we render a new graph, using a useEffect hook that watches the movies state. This is where the relationship calculation logic runs: how you define relationships and weight each parameter determines how the final graph looks. The possibilities are endless, and it’s a great opportunity to experiment with different approaches.
Here, we are using one API call for each movie, which can be problematic since the TMDb API has a rate limit of around 40 requests per second. One option would be to fetch keywords during the movie search, at the cost of larger storage requirements.
React and D3 Integration Challenges
Once we have our movie library filled with seen films, it is time to actually draw the graph. As before, we use a React useEffect hook to track when the movies state changes and run the graph rendering function again. For the graph, we use the JavaScript library D3, a free, open-source library for visualizing data. In particular, we implement a force-directed graph component, which is a highly customizable type of network visualization. At a technical level, the graph is an SVG element that updates dynamically as the simulation runs and as the user interacts with it.
The main challenge here is that D3 directly manipulates the DOM (imperative approach), while React follows a declarative model based on state changes. To solve this, we use React’s useRef hook. useRef is a React Hook that gives you a persistent mutable reference across renders to have direct access to a DOM element. While React controls when the component renders, inside the referenced SVG element, D3 takes control and manages all graphical elements and updates.
Each time the movies state changes, the effect runs again, and the graph is recalculated and redrawn. In this implementation, the SVG content is cleared and rebuilt, allowing D3 to create a new simulation based on the updated data.
Force Directed graph
The main idea behind a force-directed graph is that nodes start without a defined layout, and a physical simulation progressively arranges them into a stable structure using different forces. Our four forces present in our graph are:
- Link Force: This is an attraction force between every pair of nodes based on their relationship strength. If the strength is higher than a certain threshold, D3 draws a line and applies a force.
- Center Force: A force that attracts the nodes to the center of the SVG.
- Many Body Force or Repulsion: A repulsion force between nodes that can be compared to an electrostatic field where all nodes behave like charged particles pushing each other away.
- Collision: A force that prevents node overlapping by forcing a minimum radius around each node.
Then, we use the method simulation.on(“tick”, …) where D3 recalculates node positions and forces and renders the graph accordingly. The simulation continues until it stabilizes, which happens when the system’s internal energy decreases.
The balance between these forces and their parameters determines the final form of the graph and how the data is represented. To achieve a desired result, a trial-and-error process must be done, not only adjusting the force parameters but also how the nodes are related to each other. This balance is the key to good data visualization and what enables us to understand what our data is telling us.
Here is a showcase of my graph. (Apologies for the video quality.)
Here is my particular implementation of the graph, the code is quite long and may be confusing at first sight, I highly recommend checking the official documentation and examples to better understand the simulation model:
1 | useEffect(() => { |
To make the graph more interesting and interactive, I have also added a zoom function and the ability to drag nodes manually, as you can see in the graph showcase above. You can observe that when moving nodes, the others automatically rearrange themselves.
Future improvings
While the current prototype is fully functional, there are two scalability challenges. First, the relationship calculation logic currently runs at O(n^2) complexity due to the nested loops; although this is negligible for small movie libraries, it would become a significant performance bottleneck as the dataset grows. Second, every keystroke triggers an API request to TMDb; implementing a short delay before making an API call (debouncing) would not only preserve API quotas but also enhance performance on both the server and the final user PC.
Final Thoughts
Building this application was a great opportunity to explore the challenges of integrating React and D3. The main difficulty is that these two approaches—React’s declarative model and D3’s imperative DOM manipulation—require careful coordination. Using useRef as a bridge between them allows both libraries to coexist.
What I would highlight about this project is the power of combining specialized libraries to create rich data visualizations. The force-directed graph is just one example; D3 offers many ways to represent data creatively. The real value lies in choosing the right representation for your data and refining it until it reveals relevant patterns.
If you’re interested in exploring this further, I encourage you to experiment with different relationship metrics, add filtering options, or try other force parameters. Data visualization is as much art as it is science, and I will definitely try other approaches in the future, so stay tuned for upcoming posts. For the moment, feel free to check my other posts.